


Page 149 - Index
P. 149
Mission-Critical Decisions, Made with Confidence.
Sr.
No.
Initiative
undertaken
Details of the initiative (Web-link, if any, may be provided along with summary) Outcome of
the initiative
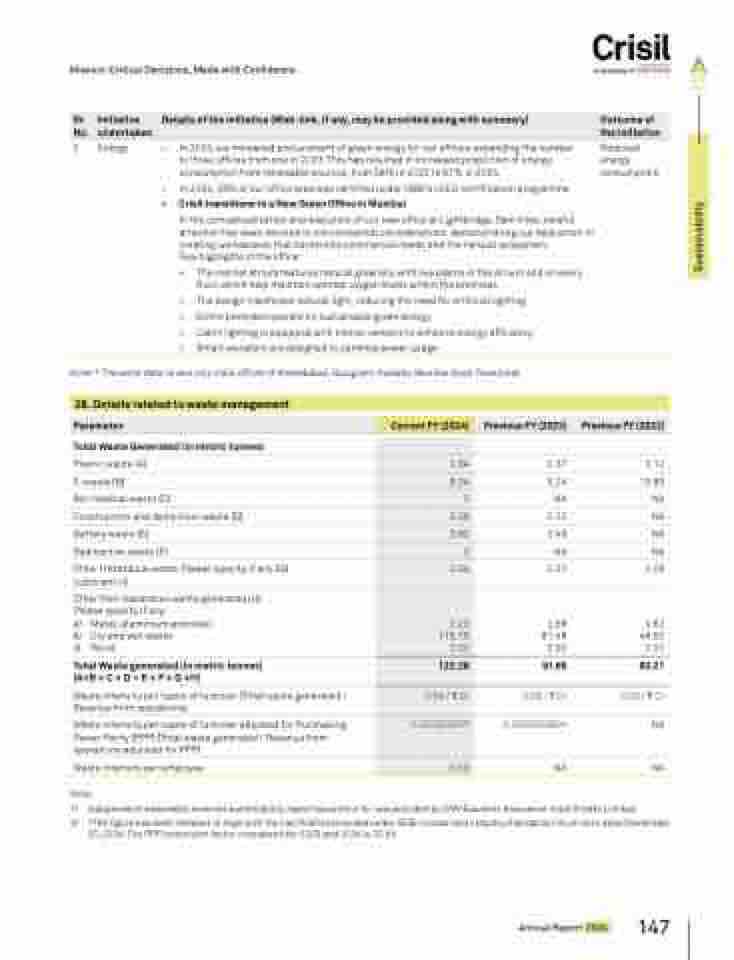
2. Energy• In 2024, we increased procurement of green energy for our offices, expanding the number
to three offices from one in 2023. This has resulted in increased proportion of energy
consumption from renewable sources, from 58% in 2023 to 67% in 2024.
•
In 2024, 33% of our office area was certified under IGBC’s LEED certification programme
• Crisil transitions to a New Green Office in Mumbai
In the conceptualisation and execution of our new office at Lightbridge, Saki Vihar, careful
attention has been devoted to environmental considerations, demonstrating our dedication to
creating workspaces that harmonise commercial needs and the natural ecosystem.
Few highlights of the office:
•
 The central atrium features natural greenery, with live plants in the atrium and on every
floor, which help maintain optimal oxygen levels within the premises
•
The design maximises natural light, reducing the need for artificial lighting
•
Entire premises operate on sustainable green energy
•
Cabin lighting is equipped with motion sensors to enhance energy efficiency
•
Smart elevators are designed to optimise power usage
Reduced
energy
consumption
Total Waste generated (in metric tonnes)
(A+B + C + D + E + F + G +H)
122.28 91.65 63.21
Waste intensity per rupee of turnover (Total waste generated /
Revenue from operations)
0.04 / C Cr 0.03 / C Cr 0.02 / C Cr
Waste intensity per rupee of turnover adjusted for Purchasing
Power Parity (PPP) (Total waste generated / Revenue from
operations adjusted for PPP)
0.000000077 0.000000060* NA
Waste intensity per employee 0.02 NA NA
Note:
1) 2) Independent reasonable external sustainability report assurance for was provided by DNV Business Assurance India Private Limited.
*The figure has been restated to align with the clarification provided under SEBI circular and Industry Standards Forum note dated December
20, 2024. The PPP conversion factor considered for 2023 and 2024 is 20.66.
Annual Report 2024
147
Sustainability
Note: * The water data covers only India offices of Ahmedabad, Gurugram, Kolkata, Mumbai (two), Pune (one).
28. Details related to waste management
Parameter Current FY (2024) Previous FY (2023) Previous FY (2022)
Total Waste Generated (in metric tonnes)
Plastic waste (A) 1.34 0.37 0.12
E-waste (B) 3.24 5.24 15.89
Bio-medical waste (C) 0 NA NA
Construction and demolition waste (D) 0.06 0.12 NA
Battery waste (E) 3.62 2.49 NA
Radioactive waste (F) 0 NA NA
Other Hazardous waste. Please specify, if any. (G)
Lubricant oil
0.04 0.37 0.09
Other Non-hazardous waste generated (H).
Please specify, if any.
a) Metal, aluminium and steel
b) Dry and wet waste
c) Wood
0.23
113.75
0.00
0.69
81.48
0.90
0.62
46.50
0.00


