


Page 66 - Index
P. 66
Details As at December 31,
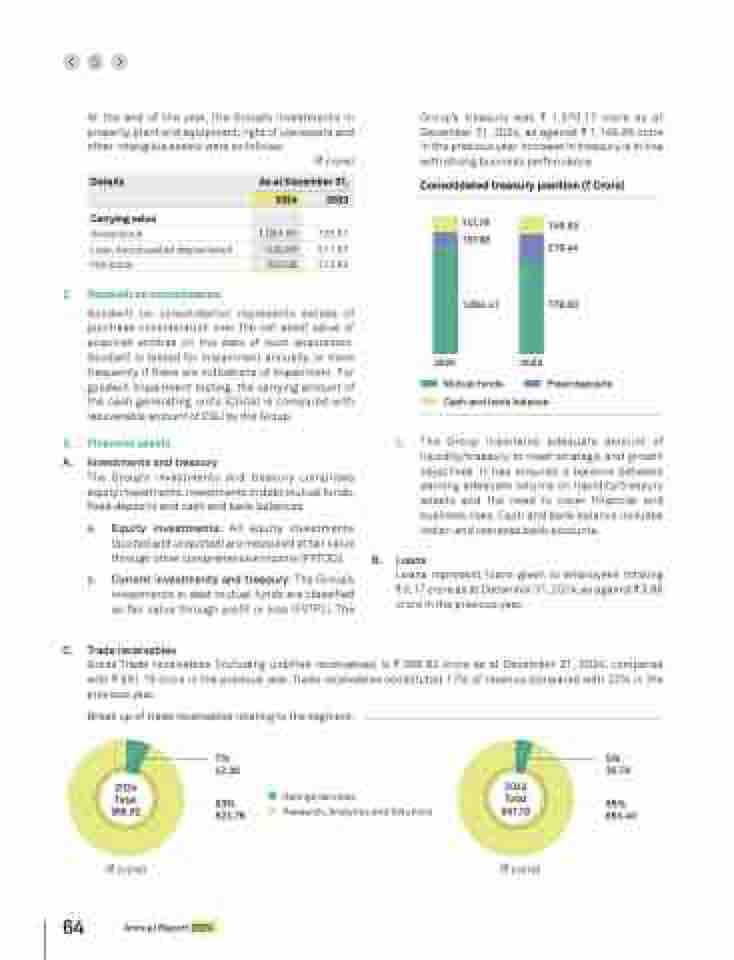
Group’s treasury was C 1,370.17 crore as at
December 31, 2024, as against C 1,146.99 crore
in the previous year. Increase in treasury is in line
with strong business performance.
Consolidated treasury position (` Crore)
Gross block 1,081.65 725.51
147.78 157.98
Less: Accumulated depreciation 530.66 511.67
Net block 550.99 213.84
1,064.41
149.55
219.44
778.00
2024 2023
Mutual funds
Cash and bank balance
Fixed deposits
At the end of the year, the Group’s investments in
property, plant and equipment, right of use assets and
other intangible assets were as follows:
(C crore)
2024 2023
Carrying value
2. Goodwill on consolidation
Goodwill on consolidation represents excess of
purchase consideration over the net asset value of
acquired entities on the date of such acquisition.
Goodwill is tested for impairment annually, or more
frequently if there are indications of impairment. For
goodwill impairment testing, the carrying amount of
the cash generating units (CGUs) is compared with
recoverable amount of CGU by the Group.
3. Financial assets
c. The Group maintains adequate amount of
liquidity/treasury to meet strategic and growth
A. Investments and treasury
The Group’s investments and treasury comprises
equity investments, investments in debt mutual funds,
fixed deposits and cash and bank balances.
objectives. It has ensured a balance between
earning adequate returns on liquidity/treasury
assets and the need to cover financial and
business risks. Cash and bank balance includes
a. Equity investments: All equity investments
Indian and overseas bank accounts.
(quoted and unquoted) are measured at fair value
through other comprehensive income (FVTOCI).
b. Current investments and treasury: The Group’s
investments in debt mutual funds are classified
as fair value through profit or loss (FVTPL). The
B. Loans
Loans represent loans given to employees totaling
C 6.17 crore as at December 31, 2024, as against C 3.88
crore in the previous year.
C. Trade receivables
Gross Trade receivables (including unbilled receivables) is C 566.82 crore as at December 31, 2024, compared
with C 691.19 crore in the previous year. Trade receivables constituted 17% of revenue compared with 22% in the
previous year.
Break up of trade receivables relating to the segment:
7%
42.06
2024
Total
566.82
93%
524.76
Ratings services
Research, Analytics and Solutions
2023
Total
691.19
5%
36.79
95%
654.40
(C crore)
(C crore)
64 Annual Report 2024


