


Page 69 - Index
P. 69
Mission-Critical Decisions, Made with Confidence.
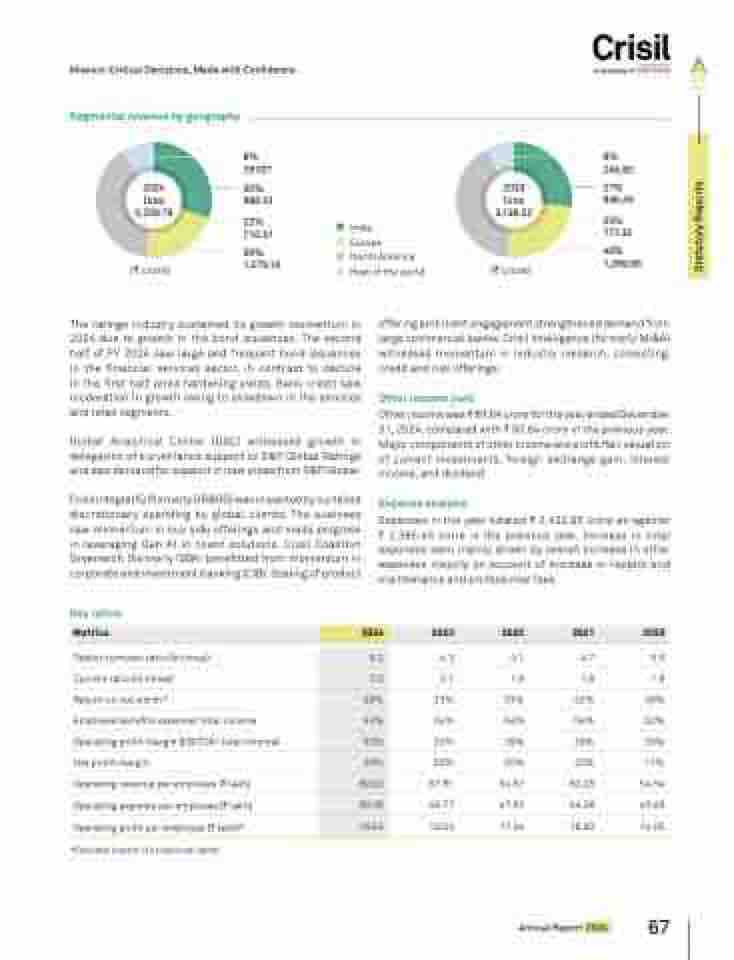
Segmental revenue by geography
2024
Total
3,259.78
9%
287.07
30%
986.10
22%
710.51
39%
2023
Total
3,139.52
(C crore)
India
Europe
North America
1,276.10 (C crore)
Rest of the world
8%
245.80
27%
846.45
25%
777.32
40%
1,269.95
The ratings industry sustained its growth momentum in
2024 due to growth in the bond issuances. The second
half of FY 2024 saw large and frequent bond issuances
in the financial services sector, in contrast to decline
in the first half amid hardening yields. Bank credit saw
moderation in growth owing to slowdown in the services
and retail segments.
Global Analytical Center (GAC) witnessed growth in
delegation of surveillance support to S&P Global Ratings
and saw demand for support in new areas from S&P Global.
Crisil Integral IQ (formerly GR&RS) was impacted by curtailed
discretionary spending by global clients. The business
saw momentum in buy side offerings and made progress
in leveraging Gen AI in client solutions. Crisil Coalition
Greenwich (formerly GBA) benefitted from momentum in
corporate and investment banking (CIB). Scaling of product
offering and client engagement strengthened demand from
large commercial banks. Crisil Intelligence (formerly Ml&A)
witnessed momentum in industry research, consulting,
credit and risk offerings.
Other income (net)
Other income was C 89.64 crore for the year ended December
31, 2024, compared with C 93.64 crore in the previous year.
Major components of other income are profit/fair valuation
of current investments, foreign exchange gain, interest
income, and dividend.
Expense analysis
Expenses in the year totaled C 2,422.95 crore as against
C 2,365.46 crore in the previous year. Increase in total
expenses were mainly driven by overall increase in other
expenses majorly on account of increase in repairs and
maintenance and professional fees.
Key ratios
Metrics 2024 Debtor turnover ratio (in times) 5.2 4.3 4.1 4.7 5.5
Current ratio (in times) 2.0 2.1 1.9 1.8 1.6
Return on net worth * 29% 33% 33% 32% 29%
Employee benefits expense/ total income 53% 54% 54% 54% 52%
Operating profit margin (EBITDA/ total income) 30% 30% 29% 29% 29%
2023 2022 2021 2020
*Excludes impact of exceptional items
Net profit margin 20% 20% 20% 20% 17%
Operating revenue per employee (C lakh) 69.92 67.81 64.67 60.28 54.54
Operating expense per employee (C lakh) 50.39 48.77 47.63 44.28 40.49
Operating profit per employee (C lakh)* 19.54 19.04 17.04 16.00 14.05
Annual Report 2024
67
Statutory Reports


