
Page 208 - Crisil Annual Report 2023
P. 208
Particulars
Year ended December 31, 2023
Year ended December 31, 2022
335
3,941
1,554
297
316
158
12,622
14,762
4,351
62
23
895
272
1,745
436
522
51,025
Printing and stationery
Conveyance and travelling
Books and periodicals
Remuneration to non-whole time directors (refer to note 38) Business promotion and advertisement
Foreign exchange loss
Professional fees
Associate service fee
Software purchase and maintenance expenses Provision for doubtful trade receivables Provision on other financial assets
Corporate social responsibility (CSR) expenses (refer to note 38) Auditors' remuneration
Recruitment expenses
Sales commission
Miscellaneous expenses
Total
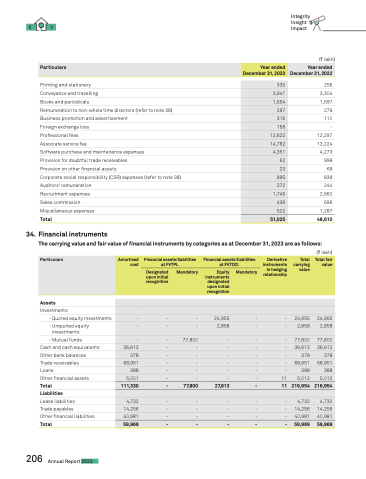
34. Financial instruments
Integrity Insight Impact
(C lakh)
255 3,304 1,597 279 110 - 12,297 13,224 4,273 998 69 839 244 2,660 696 1,287 48,610
The carrying value and fair value of financial instruments by categories as at December 31, 2023 are as follows:
(C lakh)
Particulars
Amortised cost
Financial assets/liabilities at FVTPL
Financial assets/liabilities at FVTOCI
Derivative instruments in hedging relationship
Total carrying value
Total fair value
Designated upon initial recognition
Mandatory
Equity instruments designated upon initial recognition
Mandatory
-
-
-
24,955
-
-
24,955
24,955
-
-
-
2,858
-
-
2,858
2,858
-
-
77,800
-
-
-
77,800
77,800
36,612
-
-
-
-
-
36,612
36,612
378
-
-
-
-
-
378
378
68,951
-
-
-
-
-
68,951
68,951
388
-
-
-
-
-
388
388
5,001
-
-
-
-
11
5,012
5,012
111,330
-
77,800
27,813
-
11
216,954
216,954
4,732
-
-
-
-
-
4,732
4,732
14,256
-
-
-
-
-
14,256
14,256
40,981
-
-
-
-
-
40,981
40,981
59,969
-
-
-
-
-
59,969
59,969
Assets
Investments
- Quoted equity investments
- Unquoted equity investments
- Mutual funds
Cash and cash equivalents Other bank balances Trade receivables
Loans
Other financial assets Total
Liabilities
Lease liabilities
Trade payables
Other financial liabilities Total
206 Annual Report 2023
