


Page 290 - Index
P. 290
Standalone
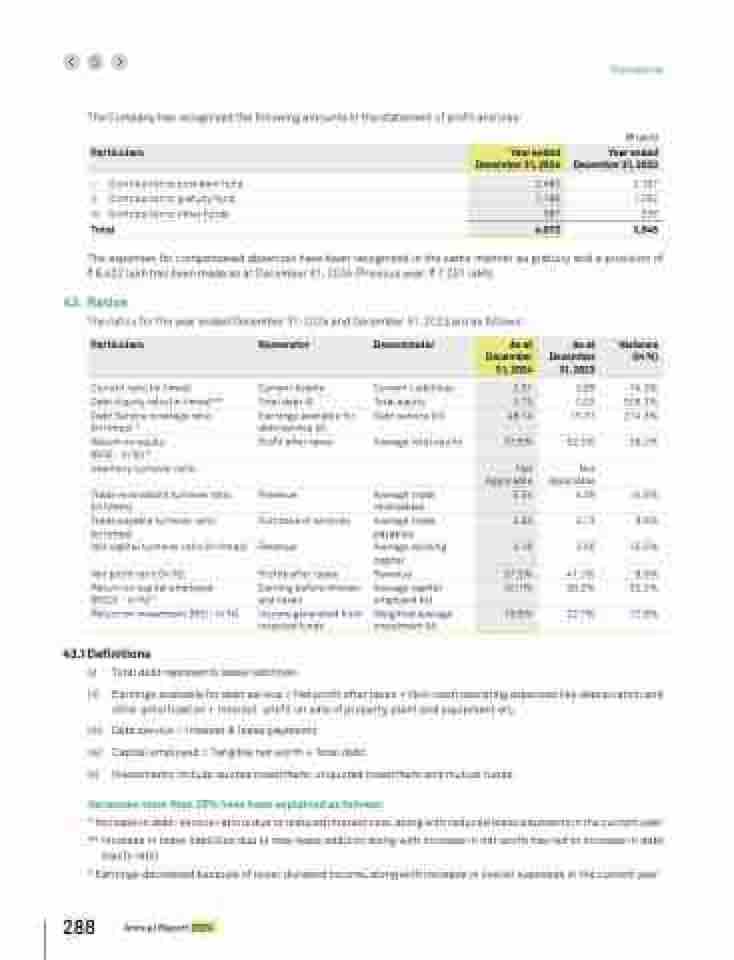
The Company has recognised the following amounts in the statement of profit and loss:
Particulars Year ended
December 31, 2024
(J lakh)
Year ended
December 31, 2023
i. Contribution to provident fund 2,490 2,167
ii. Contribution to gratuity fund 1,195 1,052
iii. Contribution to other funds 387 326
Total 4,072 3,545
The expenses for compensated absences have been recognised in the same manner as gratuity and a provision of
C 8,422 lakh has been made as at December 31, 2024 (Previous year: C 7,251 lakh).
43. Ratios
The ratios for the year ended December 31, 2024 and December 31, 2023 are as follows:
Particulars Numerator Denominator Variance
(in %)
Current ratio (in times) Current Assets Current Liabilities 2.31 2.69 -14.3%
Debt-Equity ratio (in times) ** Total debt (i) Total equity 0.13 0.02 506.3%
Debt Service coverage ratio
(in times) ^
Return on equity
(ROE - in %) #
Profit after taxes Average total equity 37.6% 52.2% -28.0%
Inventory turnover ratio Not
Applicable
Not
Applicable
Trade receivables turnover ratio
(in times)
Trade payable turnover ratio
(in times)
Return on capital employed
(ROCE - in %) #
As at
December
31, 2024
As at
December
31, 2023
Earnings available for
debt service (ii)
Debt service (iii) 48.14 15.31 214.3%
Revenue Average trade
receivables
Purchase of services Average trade
payables
Average working
capital
Return on investment (ROI - in %) 5.04 4.39 14.9%
4.53 4.13 9.6%
Net capital turnover ratio (in times) Revenue 2.16 2.56 -15.5%
Net profit ratio (in %) Profits after taxes Revenue 37.0% 41.0% -9.9%
Earning before interest
and taxes
Average capital
employed (iv)
40.1% 59.2% -32.3%
Income generated from
invested funds
Weighted average
investment (v)
19.8% 22.7% -12.9%
43.1 Definitions
(i) (ii) (iii) (iv) (v) Total debt represents lease liabilities.
Earnings available for debt service = Net profit after taxes + Non-cash operating expenses like depreciation and
other amortisation + Interest -profit on sale of property, plant and equipment etc.
Debt service = Interest & lease payments
Capital employed = Tangible net worth + Total debt
Investments include quoted investment, unquoted investment and mutual funds.
Variances more than 25% have been explained as follows:
^ Increase in debt-service ratio is due to reduced interest cost, along with reduced lease payments in the current year.
**  Increase in lease liabilities due to new lease addition along with increase in net worth has led to increase in debt
equity ratio
# Earnings decreased because of lower dividend income, along with increase in overall expenses in the current year
288 Annual Report 2024


