
Page 80 - Crisil Annual Report 2023
P. 80
Analysis of CRISIL’s standalone financial performance and result of operations
A. Financial performance
1. Property, plant and equipment, Right of use assets and other intangible assets
The Company’s investments in property, plant, and equipment represent cost of buildings, leasehold improvements, computers, software, office equipment, furniture, fixtures, and vehicles. Property, plant, equipment are measured at cost less accumulated depreciation and impairment losses, if any.
During the year, the Company capitalised C 34.16 crore to its gross block. Property, plant, and equipment capitalised during the year includes office equipment, computers, software, and leasehold improvements.
The Company’s right of use assets consists of office premises. The right of use assets is measured at cost less any accumulated depreciation, accumulated impairment losses, if any and adjusted for any remeasurement of the lease liability.
The Company’s other intangible assets represents software, customer relationship and platform are stated at cost of acquisition or construction less accumulated amortisation and impairment losses, if any. The estimated useful lives of intangible assets and the amortisation period are reviewed at the end of each financial year.
Depreciation as a percentage of total income was 3% in the current year. The Company expects to fund its investments in fixed assets and infrastructure from internal accruals and liquid assets.
At the end of the year, the Company’s investments in net property, plant and equipment, right of use assets and other intangible assets were C 83.21 crore as against C 116.29 crore in the previous year.
2. Financial assets
A. Investments and treasury:
The Company’s investments and treasury comprises of equity investments, investments in debt mutual funds, fixed deposits and cash and bank balances.
b.
Integrity Insight Impact
Fair Value through other comprehensive income (FVTOCI).
Investments in wholly owned subsidiaries are measured at cost. As at December 31, 2023, the cost of investment in subsidiaries stood at C 153.07 crore as against C 145.86 crore in the previous year.
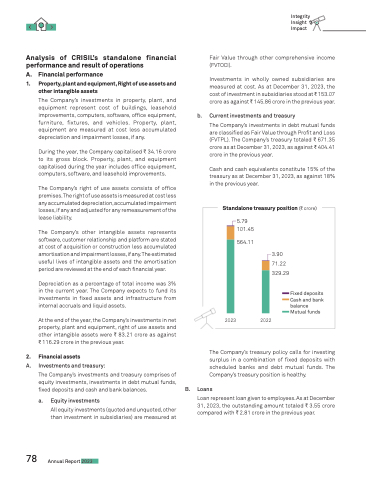
Current investments and treasury
The Company’s investments in debt mutual funds are classified as Fair Value through Profit and Loss (FVTPL). The Company’s treasury totaled C 671.35 crore as at December 31, 2023, as against C 404.41 crore in the previous year.
Cash and cash equivalents constitute 15% of the treasury as at December 31, 2023, as against 18% in the previous year.
Standalone treasury position (C crore) 5.79
101.45 564.11
3.90 71.22 329.29
78
Annual Report 2023
a.
Equity investments
All equity investments (quoted and unquoted, other than investment in subsidiaries) are measured at
B.
Loans
Loan represent loan given to employees. As at December 31, 2023, the outstanding amount totaled C 3.55 crore compared with C 2.81 crore in the previous year.
2023
2022
The Company’s treasury policy calls for investing surplus in a combination of fixed deposits with scheduled banks and debt mutual funds. The Company’s treasury position is healthy.
Fixed deposits Cash and bank balance Mutual funds
